Part of my series of answers to frequently asked questions about community participation in localization or translation projects.
I’ve often considered creating a FAQ on this site covering answers to common questions about community-driven localization. Without fail, the most common question I get is, “But if they’re all volunteers, how do you ensure quality?” I can get into the issues with the underlying assumption in that question later. This time around, I’m going to address one of the more common quality control mechanisms for (dare I say it) crowdsourced localization and translation projects: the leaderboard.
Leaderboards are a gamification mechanism used in projects to identify the top (loose application of the term) contributors to a project. In translation projects, they often only look at one metric: volume of translations contributed. The idea is that by using competition and visibility as motivators, community members will contribute more translations if their profile can rise higher on the leaderboard. Host organizations can use this data to make decisions about further rewarding these contributors with extrinsic motivators (gear, certificates, etc.). This, unfortunately, makes gaming a leaderboard system quite easy. All one needs to do is copy/paste source language content into Google Translate and copy/paste the translated output into the host’s translation platform. Boom! Suddenly they’re at the top of the leaderboard.
Trusting such a one-dimensional metric of this type is a mistake, plain and simple. A leaderboard of this type rewards community members for the very thing host organizations want to avoid: bad quality translations. What would a leaderboard that rewards community members for the right things look like? The Lingotek platform offers a good example of how to accomplish this.

Lingotek goes beyond the common metric used by the traditional leaderboard. It focuses on specific events performed either by the community member and events with a direct impact on the community member’s work. “Translate a New Segment” is the metric we’re all used to seeing, but the other metrics paint a more detailed picture of the community member. We can get a sense for how often they contribute by looking at the leaderboard columns. We can also see whether their translations are being reviewed (which may provoke specific action by the host organization to train up reviewers), whether someone else in the community thinks they’re good quality (through voting), and how many of their translations are accepted. This system is more difficult to game as each metric gives a sense of the quality of the contributions rather than exclusively focusing on the quantity. It also relies on the involvement of other individuals in the community to review the translations, fostering a sense of collaboration within the community.

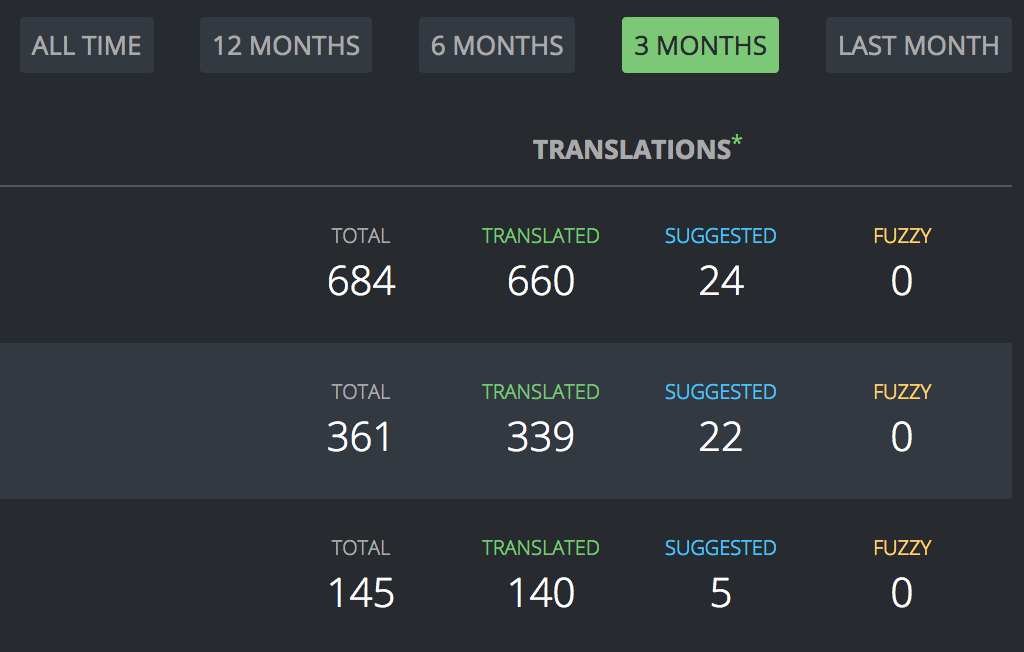
Mozilla’s open source translation platform (Pontoon) follows a similar path. When a “Suggestion” is reviewed, the statistic is converted over to a “Translation.” We hope to add further statistics, such as an accept/reject ratio, to further foster a collaborative quality control environment and recognize individuals whose contributions are of high quality. These can also help community leaders to identify promising newcomers and increase their user privileges and add to their growing leadership responsibilities. All of this creates an environment where community members are recognized for the quality of their contributions, not the quantity.
I hope you’ve enjoyed my first FAQ post. If you know of other platforms that have solid leaderboards, comment below.
